Where the story begins
Commercial crude stocks rose slightly, while gasoline and distillate inventories fell and remained below seasonal comparisons.
Official source fact · EvidenceRefinery product mix, storage locations and actual demand stand between crude oil and finished products. A rise in crude inventories alone does not show that product-specific supply constraints have eased.
SignalTrace interpretation · EvidenceWe will check the next EIA weekly report and official operating disclosures to see whether the divergence between crude and product inventories persists.
Outlook · Evidence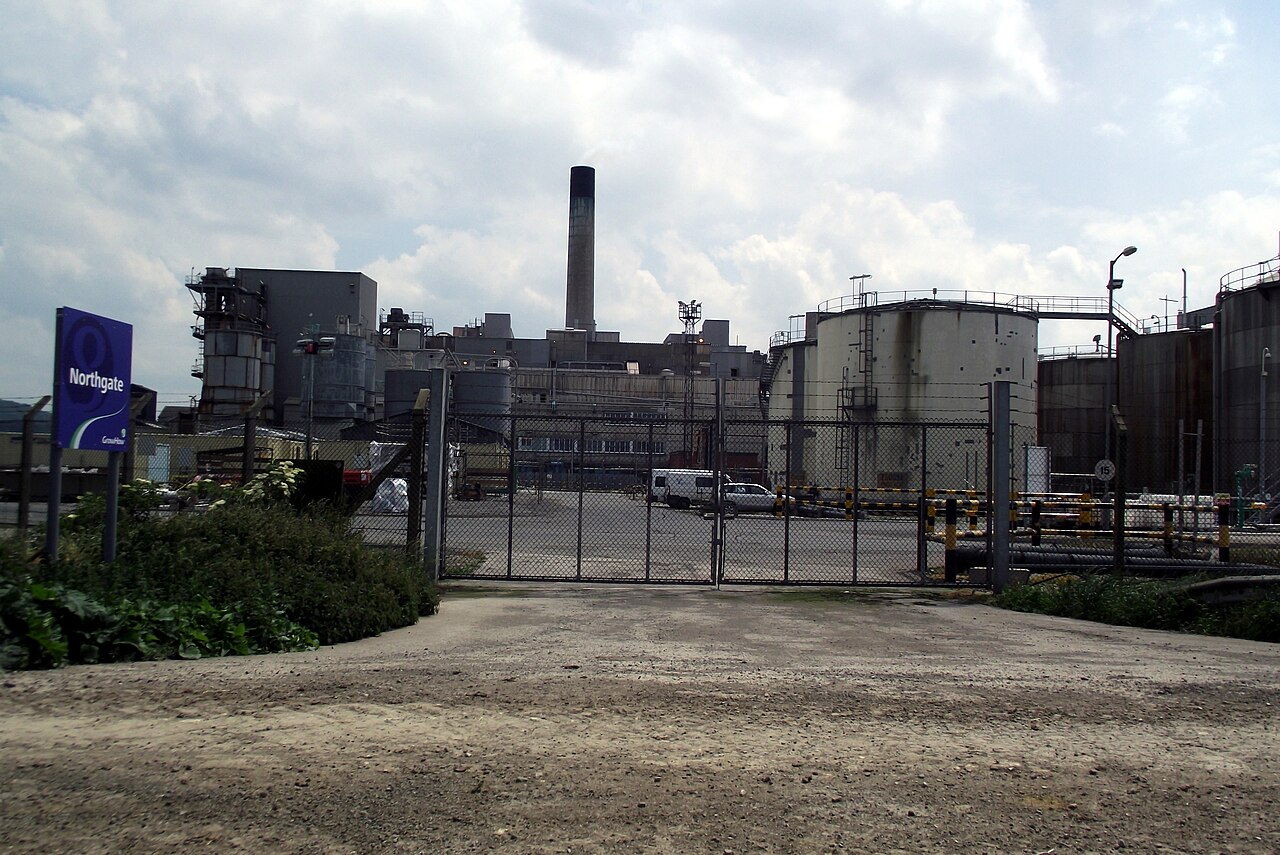
Crude oil passes through a refinery to become petroleum products. This photograph shows Stanlow in the United Kingdom in 2011; it does not depict the US weekly inventory conditions discussed in the article.
Photo: Joe Blundell · 2011-06-04 · CC BY-SA 3.0. The 1280px version supplied by Wikimedia. No additional cropping or retouching.
EIA explanation and diagram of oil refining (July 5, 2012) →
What happened
U.S. commercial crude inventories rose slightly in the week ended August 21. Gasoline and distillate inventories fell, remaining below their averages for the same time of year over the past five years.
Official source fact · EvidenceThe transmission runs from crude supply through refinery inputs and product mix, then through regional storage and transport demand. More crude in storage therefore does not mean every petroleum product is in ample supply.
SignalTrace interpretation · EvidenceWe strengthen this interpretation only when subsequent EIA data and official company operating evidence confirm the same divergence between crude and product inventories. Investment actions are outside the scope of this report.
Outlook · EvidenceCommercial crude inventories rose slightly in the official report.
Official source fact · EvidenceRefinery inputs changed little, and utilization remained high.
Official source fact · EvidenceDistillate inventories fell and remained below their seasonal comparison.
Official source fact · EvidenceWe check whether crude inventories, refinery production and product inventories continue to move in different directions.
Outlook · EvidenceCommercial crude inventories → refinery inputs and utilization → product mix → regional storage and logistics → transport and industrial demand → company operating evidence
SignalTrace interpretation · EvidenceWe weaken the divergence interpretation if the next report shows distillate inventories recovering while refinery output stays similar. One week of data does not establish company outcomes.
SignalTrace interpretation · EvidenceHow money and activity connect
From observed facts to possible effects. Interpretations and outlooks are distinct from established results.
SignalTrace interpretation
Commercial crude stocks rose slightly, while distillate and gasoline inventories fell.
SignalTrace interpretation · EvidenceSignalTrace interpretation
Crude supply reaches end users through refinery throughput, product mix, storage locations and transport demand.
SignalTrace interpretation · EvidenceSignalTrace interpretation
We will check the next EIA weekly report and official operating disclosures from transport companies and refiners.
SignalTrace interpretation · EvidenceSignalTrace interpretation
Without company evidence at the same cutoff, we do not infer an earnings direction or investment action.
SignalTrace interpretation · EvidenceHow to read the evidence
Before crude reaches end users as transport or industrial fuel, it must pass through refinery configurations, product mixes, storage and logistics.
SignalTrace interpretation · EvidenceCheck commercial inventories and imports. Review refinery inputs, utilization and product mix. Separate gasoline, distillates and other fuels. Check product supplied and official operating evidence.
SignalTrace interpretation · EvidenceDoes more crude mean ample supplies of every fuel?
Follow-up question · EvidenceNo. Refinery product mix, regional storage and final demand can produce different supply conditions for each product.
SignalTrace interpretation · EvidenceCan one weekly report establish a company's earnings?
Follow-up question · EvidenceNo. It needs to be connected to company throughput, inventories and cash-flow evidence for the same period.
SignalTrace interpretation · EvidenceWhat to check by industry
Refinery product mix, regional storage and final demand transmit a given crude inventory change into actual operating conditions.
SignalTrace interpretation · EvidenceRefinery throughput and product mix determine how much crude supply becomes product supply. Check inputs and utilization, product mix and outages, then inventories and cash flow. We weaken the interpretation if official throughput and inventory evidence do not confirm the channel.
SignalTrace interpretation · EvidenceDistillate supply connects petroleum supply to freight and industrial activity. Assess distillate inventories alongside transport volumes, fuel use, utilization and cash flow. We weaken the interpretation if official demand and operating evidence do not confirm the channel.
SignalTrace interpretation · EvidenceRegional storage and transport can make local supply conditions differ from national totals. Compare regional inventories, pipeline and terminal throughput, transport volumes and cash flow. We weaken the interpretation if official regional data and operating evidence do not confirm the channel.
SignalTrace interpretation · EvidenceWhat differs from past cases
Refinery configurations and product mixes can send crude and distillate inventories along different paths.
SignalTrace interpretation · EvidenceWe use this only as a conditional comparison until the next weekly data confirm persistence.
SignalTrace interpretation · EvidenceThe official tables separate inventories by region and product, so national totals cannot represent supply in every region.
Official source fact · EvidenceWithout official regional data and operating evidence, we do not extend this comparison to individual companies.
SignalTrace interpretation · EvidenceWhat would change the assessment
Official evidence showed a small rise in commercial crude inventories, while distillate inventories moved in the opposite direction.
SignalTrace interpretation · EvidenceWe strengthen the interpretation only when subsequent weekly data and official company operating evidence confirm the channel. Investment actions are outside the scope of this report.
Outlook · EvidenceQuestions for the next release
Does the divergence between crude and distillate inventories persist?
Follow-up question · EvidenceDo throughput, product mix and inventories confirm the channel?
Follow-up question · EvidenceDo freight volumes and fuel use confirm the demand channel?
Follow-up question · EvidenceOur assessment
The EIA release showed a small rise in commercial crude stocks, while distillate inventories fell and remained below seasonal comparisons. We do not assess company effects until throughput, transport volumes, inventories and operating cash flow connect for the same period.
SignalTrace interpretation · Evidence